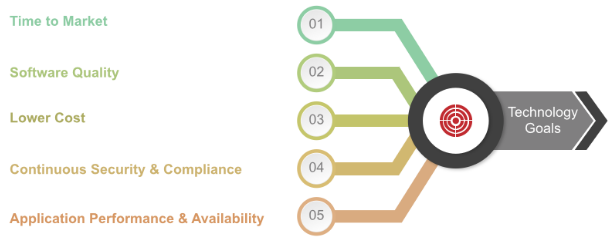
We live in a world where time to market and delivery timelines are only getting shorter for technology transformation initiatives. Enterprise or ISV, the expectations are the same. Add to it the following additional needs –
- Higher Software Quality
- Faster Issue Identification & Resolution
- Better & Proactive Security
- Continuous Compliance
- Reduced Cost of Delivery & Operations
It does not get any tougher.

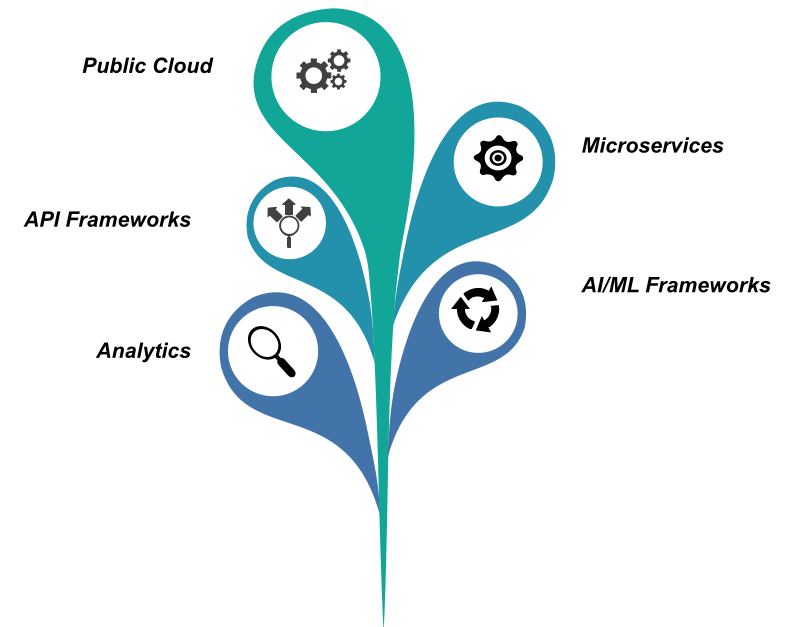
It is both challenging and interesting time to be a Technology Leader; challenging because of the needs mentioned above; interesting because of the many technology advancements in the past decade some of which include –
- Public Cloud (aws, azure, google cloud)
- Microservices (kubernetes, docker, serverless, istio)
- AI/ML Frameworks (tensorflow, pytorch, mxnet)
- Analytics (snowflake, hadoop, tableau)
- API Frameworks (apigee, mulesoft)

Adopting DevOps practices is key to achieving the above stated goals using these advanced technologies. Defining, tracking and learning from the KPIs (on DevOps Dashboards) is critical to continuous improvement and success with DevOps initiatives.
KPIs can be classified across the following high level business goals
- Cost
- Time to Market
- Quality
- Security / Compliance
- Application Performance / Availability
It is important to first identify business priorities amongst the goals listed above. Identifying the top two priorities is more pragmatic.
Once the business goals are prioritized, the next step is to identify the detailed DevOps KPIs per business application. Some of the important DevOps KPIs are listed below –
| KPI | Description |
| Lead Time | Total elapsed time from feature identification to availability in production |
| Process Time | Total time taken for actual work from feature identification to availability in production |
| %C/A | What percentage of the time is the work delivered in this step acceptable to the next step in the value stream |
| Deployment Frequency | How often deployments are performed |
| Defect Density | What percentage of the backlog is comprised of defects to be fixed |
| Mean Time to Detection | Average time taken to identify an application issue |
| Mean Time to Recover | Average time taken to recover from a failure |
| Mean Time Between Failures | Average time between two failures |
| Automated Test Coverage | % of test cases automated |
| Deployment Time | Time taken for each deployment |
| Change Failure Rate | % of deployments that fail in production |
| Automated Tests Defect Rate | % of automated tests that fail |
| Feature Usage | % of target user base that is using a new feature |
| Batch Size | Number of features (points) delivered per release |
| Defect Rate | Failure rate |
| Application Availability | Availability of the application per month |
| Customer Tickets | Number of customer tickets per month |
| Defect Escape Rate | Number of issues found in production as against lower environments |
KPIs should also be identified for each of the stakeholder persona like the following –
- Product Owner
- Product Manager
- Scrum Master
- Technology Owner
- Engineering Manager
- QA Manager
- Developer
- Operations Manager
- Security Officer
- Compliance Officer
- Site Reliability Engineer
Some of the KPIs of importance for each of these roles are mentioned below –
| Role | KPIs |
| Product Owner |
|
| Product Manager |
|
| Scrum Master |
|
| Technology Owner |
|
| Engineering Manager |
|
| QA Manager |
|
| Developer |
|
| Operations Manager |
|
| Security Officer |
|
| Compliance Officer |
|
| Site Reliability Engineer |
|
The information and data points required to derive these KPIs can be found across the following type of tools and platforms –
- Cloud Provider Services
- ALM
- ITSM
- Continuous Integration
- Continuous Delivery / Deployment
- Code Quality
- Security Testing
- Test Automation
- Compliance Assessment
- Code Repository
- Artifact Repository
- Monitoring
- Logging
Ability to gather information in real time, apply correlations, generate metrics and recommendations from the above tools and platforms is critical to a comprehensive DevOps Dashboard that can subsequently help drive continuous improvement.
You can either adopt an approach of building such comprehensive dashboards yourself or use platforms like Kaiburr that provide real time dashboards out of the box for all stakeholders with information from tools across the development life cycle.
Whatever be your approach, good luck with your technology transformation initiatives and I hope the information provided in this post gives you a good starting point. Cheers.
